Correct Answer

verified
Correct Answer
verified
True/False
Predictive analytics invokes advanced optimization tools to recommend a strategy or action.
Correct Answer

verified
Correct Answer
verified
Essay
Explain business analytics.
Correct Answer

verified
Business analytics uses tools and techni...View Answer
Show Answer
Correct Answer
verified
View Answer
True/False
PivotTables are easiest to read if there is at most one field in the Rows area and one field in the Columns area.
Correct Answer

verified
Correct Answer
verified
Multiple Choice
Which of the following is NOT one of the three approaches for data mining?
A) text analysis
B) sentiment analysis
C) opinion mining
D) pattern analytics
E) test analysis
Correct Answer

verified
Correct Answer
verified
Multiple Choice
The following figure is an example of a ________. 
A) PivotTable
B) heat map
C) color map
D) heat zone
E) visual inspection grid
Correct Answer

verified
Correct Answer
verified
Multiple Choice
Which of the following data visualization graphs plots data that are readily divided into categories?
A) bar graph
B) line graph
C) slope graph
D) network diagram
E) scatter diagram
Correct Answer

verified
Correct Answer
verified
Multiple Choice
Which of the following statements is FALSE?
A) Predictive analytics invokes advanced optimization tools to recommend a strategy or action.
B) Descriptive analytics analyzes past data to predict the future.
C) Prescriptive analytics characterizes and summaries data to facilitate understanding.
D) None of these.
E) All of these.
Correct Answer

verified
Correct Answer
verified
Multiple Choice
Which of the following business analytics tools presents an overview of the most important metrics (i.e., key success indicators) all in one place?
A) PivotTable
B) heat map
C) dashboard
D) Conditional Formatting
E) COUNTIF
Correct Answer

verified
Correct Answer
verified
Multiple Choice
Which of the following data visualization graphs shows the frequency of occurrences of a variable?
A) histogram
B) line graph
C) slope graph
D) network diagram
E) regression line
Correct Answer

verified
Correct Answer
verified
True/False
Walmart's databases are estimated to contain more than 2.5 petabytes, the same size as the entire U.S. Library of Congress book collection.
Correct Answer

verified
Correct Answer
verified
Short Answer
PivotTables are easiest to read if there is(are) at most ________ field(s) in the Rows area and ________ field(s) in the Columns area.
Correct Answer

verified
Correct Answer
verified
Short Answer
A heat map uses colors to represent values, with ________ colors applied to more extreme values and ________ colors applied to more moderate values.
Correct Answer

verified
Correct Answer
verified
Multiple Choice
Which of the following statements is TRUE regarding data management?
A) Managers should always remove the entire record with any missing values.
B) Once managers conclude that the data is consistent, they look for completeness.
C) Consistency refers to the degree of conformity of a measure to a standard value.
D) Mangers need to identify "outliers" after they are accepted into the dataset.
E) Data can be stored three ways: character, pattern, or numeric.
Correct Answer

verified
Correct Answer
verified
Multiple Choice
Which of the following data visualization graphs provides a best-fit line through a central tendency of points on a graph?
A) histogram
B) line graph
C) slope graph
D) scatter diagram
E) regression line
Correct Answer

verified
Correct Answer
verified
Multiple Choice
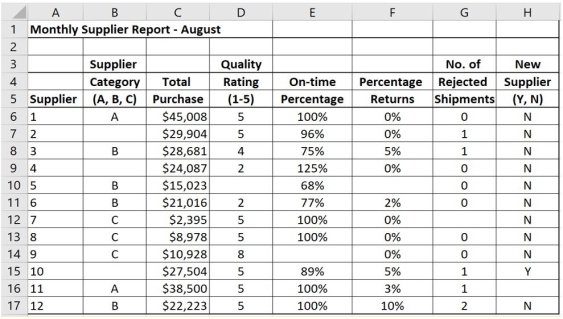
How many empty cells are there in the following dataset? 
A) 0
B) 6
C) 8
D) 13
E) 28
Correct Answer

verified
Correct Answer
verified
Short Answer
Business analytics uses tools and techniques to convert data into ________ and ________.
Correct Answer

verified
summary in...View Answer
Show Answer
Correct Answer
verified
View Answer
Multiple Choice
Which of the following Excel functions is used to facilitate quick accuracy checks on the extreme values?
A) AVERAGE
B) SMALL
C) MEDIAN
D) STDEV
E) QUARTILE
Correct Answer

verified
Correct Answer
verified
True/False
A heat map uses colors to represent values, with lighter colors applied to more extreme values and darker colors applied to more moderate values.
Correct Answer

verified
Correct Answer
verified
Multiple Choice
Which of the following statements regarding big data is FALSE?
A) Data collection is so massive that it is now measured in gigabytes.
B) One terabyte equals approximately one trillion bytes.
C) Walmart's databases contain more than 2.5 petabytes.
D) Digital data can be collected from web sites, credit cards, point-of-sale records, social media, and operational environments.
E) Big data requires sophistication in how it is stored, processed, and analyzed.
Correct Answer

verified
Correct Answer
verified
Showing 21 - 40 of 61
Related Exams