Filters
Question type

Study Flashcards

Figure 8-6 The vertical distance between points A and B represents a tax in the market. Figure 8-6 The vertical distance between points A and B represents a tax in the market.   -Refer to Figure 8-6. The amount of the tax on each unit of the good is A) $6. B) $8. C) $10. D) $12. -Refer to Figure 8-6. The amount of the tax on each unit of the good is


A) $6.
B) $8.
C) $10.
D) $12.

E) None of the above
F) All of the above

Correct Answer

verifed

verified

When the government imposes taxes on buyers and sellers of a good, society loses some of the benefits of market efficiency.

A) True
B) False

Correct Answer

verifed

verified

Taxes on labor encourage all of the following except


A) older workers to take early retirement from the labor force.
B) mothers to stay at home rather than work in the labor force.
C) workers to work overtime.
D) people to be paid "under the table."

E) A) and B)
F) A) and C)

Correct Answer

verifed

verified

The benefit that government receives from a tax is measured by


A) the change in the equilibrium quantity of the good.
B) the change in the equilibrium price of the good.
C) tax revenue.
D) total surplus.

E) None of the above
F) A) and D)

Correct Answer

verifed

verified

Figure 8-10 Figure 8-10   -Refer to Figure 8-10. Suppose the government imposes a tax that reduces the quantity sold in the market after the tax to Q2. The size of the tax is A) P0-P2. B) P2-P8. C) P2-P5. D) P5-P8. -Refer to Figure 8-10. Suppose the government imposes a tax that reduces the quantity sold in the market after the tax to Q2. The size of the tax is


A) P0-P2.
B) P2-P8.
C) P2-P5.
D) P5-P8.

E) A) and C)
F) A) and B)

Correct Answer

verifed

verified

Table 8-1  Marlet  Chareteristir  A  Denand is very elatic. B Denand is very inelastic. C Supply is vey elastic. D Supply is very inelatic. \begin{array} { | c | c | } \hline \text { Marlet } & \text { Chareteristir } \\\hline \text { A } & \text { Denand is very elatic. } \\\hline B & \text { Denand is very inelastic. } \\\hline C & \text { Supply is vey elastic. } \\\hline D & \text { Supply is very inelatic. } \\\hline\end{array} -Refer to Table 8-1. Suppose the government is considering levying a tax in one or more of the markets described in the table. Which of the markets will maximize the deadweight loss(es) from the tax?


A) market B only
B) markets A and C only
C) markets B and D only
D) market D only

E) B) and D)
F) A) and B)

Correct Answer

verifed

verified

The size of the deadweight loss generated from a tax is affected by the


A) elasticities of both supply and demand.
B) elasticity of demand only.
C) elasticity of supply only.
D) total revenue collected by the government.

E) C) and D)
F) All of the above

Correct Answer

verifed

verified

Figure 8-11 Figure 8-11   -Refer to Figure 8-11. The price labeled as P<sub>2</sub> on the vertical axis represents the A) difference between the price paid by buyers after the tax is imposed and the price paid by buyers before the tax is imposed. B) difference between the price received by sellers before the tax is imposed and the price received by sellers after the tax is imposed. C) price of the good before the tax is imposed. D) price of the good after the tax is imposed. -
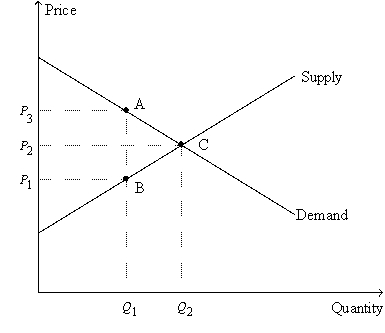
Refer to Figure 8-11. The price labeled as P2 on the vertical axis represents the


A) difference between the price paid by buyers after the tax is imposed and the price paid by buyers before the tax is imposed.
B) difference between the price received by sellers before the tax is imposed and the price received by sellers after the tax is imposed.
C) price of the good before the tax is imposed.
D) price of the good after the tax is imposed.

E) B) and D)
F) B) and C)

Correct Answer

verifed

verified

The more inelastic are demand and supply, the greater is the deadweight loss of a tax.

A) True
B) False

Correct Answer

verifed

verified

When a tax is levied on a good, the buyers and sellers of the good share the burden,


A) provided the tax is levied on the sellers.
B) provided the tax is levied on the buyers.
C) provided a portion of the tax is levied on the buyers, with the remaining portion levied on the sellers.
D) regardless of how the tax is levied.

E) A) and B)
F) B) and D)

Correct Answer

verifed

verified

Figure 8-4 The vertical distance between points A and B represents a tax in the market. Figure 8-4 The vertical distance between points A and B represents a tax in the market.   -Refer to Figure 8-4. The amount of deadweight loss as a result of the tax is A) $105. B) $210. C) $490. D) $600. -Refer to Figure 8-4. The amount of deadweight loss as a result of the tax is


A) $105.
B) $210.
C) $490.
D) $600.

E) B) and C)
F) B) and D)

Correct Answer

verifed

verified

Suppose that a university charges students a $100 "tax" to register for business classes. The next year the university raises the "tax" to $150. The deadweight loss from the "tax" triples.

A) True
B) False

Correct Answer

verifed

verified

Figure 8-11 Figure 8-11   -Refer to Figure 8-11. The price labeled as P<sub>1</sub> on the vertical axis represents the price A) received by sellers before the tax is imposed. B) received by sellers after the tax is imposed. C) paid by buyers before the tax is imposed. D) paid by buyers after the tax is imposed. -Refer to Figure 8-11. The price labeled as P1 on the vertical axis represents the price


A) received by sellers before the tax is imposed.
B) received by sellers after the tax is imposed.
C) paid by buyers before the tax is imposed.
D) paid by buyers after the tax is imposed.

E) C) and D)
F) A) and B)

Correct Answer

verifed

verified

In which of the following cases is it most likely that an increase in the size of a tax will decrease tax revenue?


A) The price elasticity of demand is small, and the price elasticity of supply is large.
B) The price elasticity of demand is large, and the price elasticity of supply is small.
C) The price elasticity of demand and the price elasticity of supply are both small.
D) The price elasticity of demand and the price elasticity of supply are both large.

E) A) and B)
F) A) and C)

Correct Answer

verifed

verified

If the size of a tax increases, tax revenue


A) increases.
B) decreases.
C) remains the same.
D) may increase, decrease, or remain the same.

E) B) and C)
F) None of the above

Correct Answer

verifed

verified

Figure 8-16 Figure 8-16   -Refer to Figure 8-16. Suppose the government imposes a $1 tax in each of the four markets represented by supply curves S1, S2, S3, and S4. The deadweight will be the smallest in the market represented by A) S1. B) S2. C) S3. D) S4. -Refer to Figure 8-16. Suppose the government imposes a $1 tax in each of the four markets represented by supply curves S1, S2, S3, and S4. The deadweight will be the smallest in the market represented by


A) S1.
B) S2.
C) S3.
D) S4.

E) None of the above
F) B) and D)

Correct Answer

verifed

verified

Figure 8-1 Figure 8-1   -Refer to Figure 8-1. Suppose the government imposes a tax of P' - P'''. The producer surplus before the tax is measured by the area A) I+J+K. B) I+Y. C) L+M+Y. D) M. -Refer to Figure 8-1. Suppose the government imposes a tax of P' - P'''. The producer surplus before the tax is measured by the area


A) I+J+K.
B) I+Y.
C) L+M+Y.
D) M.

E) B) and D)
F) None of the above

Correct Answer

verifed

verified

Figure 8-2 The vertical distance between points A and B represents a tax in the market. Figure 8-2 The vertical distance between points A and B represents a tax in the market.   -Refer to Figure 8-2. The per-unit burden of the tax on sellers is A) $2. B) $3. C) $4. D) $5. -Refer to Figure 8-2. The per-unit burden of the tax on sellers is


A) $2.
B) $3.
C) $4.
D) $5.

E) B) and C)
F) A) and D)

Correct Answer

verifed

verified

Suppose a tax of $4 per unit is imposed on a good, and the tax causes the equilibrium quantity of the good to decrease from 2,000 units to 1,700 units. The tax decreases consumer surplus by $3,000 and decreases producer surplus by $4,400. The deadweight loss of the tax is


A) $200.
B) $400.
C) $600.
D) $1,200.

E) A) and C)
F) A) and B)

Correct Answer

verifed

verified

Figure 8-4 The vertical distance between points A and B represents a tax in the market. Figure 8-4 The vertical distance between points A and B represents a tax in the market.   -Refer to Figure 8-4. The tax results in a loss of consumer surplus that amounts to A) $120. B) $340. C) $450. D) $510. -Refer to Figure 8-4. The tax results in a loss of consumer surplus that amounts to


A) $120.
B) $340.
C) $450.
D) $510.

E) A) and B)
F) A) and C)

Correct Answer

verifed

verified

Showing 121 - 140 of 422

Related Exams

Show Answer