A) demand curve will shift to the right.
B) supply curve will shift to the right
C) demand curve will shift to the left.
D) supply curve will shift to the left.
Correct Answer

verified
Correct Answer
verified
Multiple Choice
A decrease in household income for a good that is considered normal would
A) move its demand curve to the right.
B) move its demand curve to the left.
C) cause a movement along the demand curve to a (higher price, lower quantity) point.
D) cause a movement along the demand curve to a (lower price, higher quantity) point.
Correct Answer

verified
Correct Answer
verified
Multiple Choice
Which of the following goods are likely to be considered substitutes?
A) Hot dogs and hot dog buns
B) Gasoline and diesel fuel
C) Peanut butter and jelly
D) Coke and Pepsi
Correct Answer

verified
Correct Answer
verified
Multiple Choice
An increase in the excise tax imposed upon consumers of gasoline
A) shifts the demand for gasoline to the left.
B) shifts the demand for gasoline to the right.
C) shifts the supply of gasoline to the right.
D) shifts the market price of gasoline.
Correct Answer

verified
Correct Answer
verified
Multiple Choice
If a good is normal and income decreases then
A) the demand curve will shift to the right.
B) the demand curve will shift to the left.
C) the supply curve will shift to the right.
D) the supply curve will shift to the left.
Correct Answer

verified
Correct Answer
verified
Multiple Choice
On the Heritage Foundation's scale of "Economic Freedom," the least "free" country would be that one who's economic system was purely
A) capitalist.
B) socialist.
C) utilitarian.
D) communist.
Correct Answer

verified
Correct Answer
verified
Multiple Choice
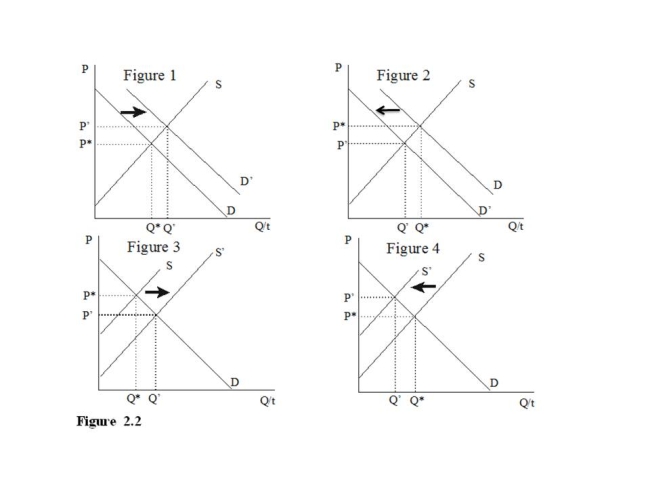
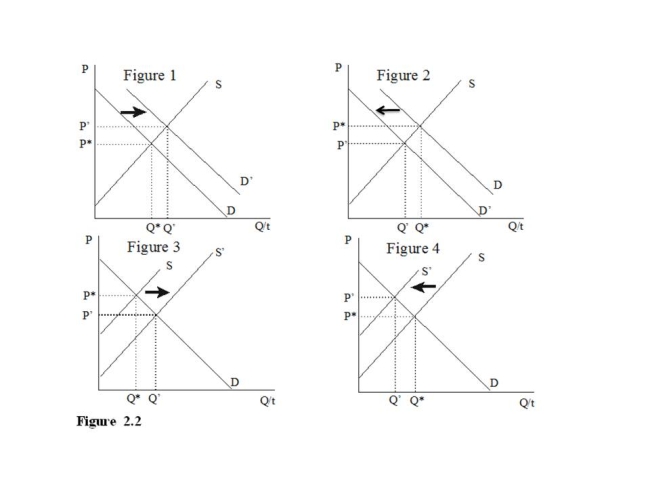
 -Of the collection of supply and demand diagrams in Figure 2.2, which one shows the result of a decrease in income if a good is considered normal?
A) Figure 1
B) Figure 2
C) Figure 3
D) Figure 4
Correct Answer

verified
Correct Answer
verified
Multiple Choice
 -From Table 2.3, at the price of $4 there is a
A) shortage of 2.
B) surplus of 2.
C) neither a shortage nor a surplus.
D) surplus of 4.
Correct Answer

verified
Correct Answer
verified
Multiple Choice
If the price of a typical good rises, the quantity demanded for that good will
A) decrease.
B) increase.
C) remain the same.
D) automatically decrease to zero.
Correct Answer

verified
Correct Answer
verified
Multiple Choice
If the price is so high that vendors find too many unsold bottles remaining in inventory, they might dispose of their excess inventory by
A) raising the price per bottle.
B) lowering the price per bottle.
C) closing early.
D) creating a surplus.
Correct Answer

verified
Correct Answer
verified
Multiple Choice
 -Of the collection of supply and demand diagrams in Figure 2.2, which one shows the result of an increase in the price of an input in the market for anything?
A) Figure 1
B) Figure 2
C) Figure 3
D) Figure 4
Correct Answer

verified
Correct Answer
verified
Multiple Choice
If a good is inferior and income increases then
A) the demand curve will shift to the right.
B) the demand curve will shift to the left.
C) the supply curve will shift to the right.
D) the supply curve will shift to the left.
Correct Answer

verified
Correct Answer
verified
Multiple Choice
Unless circumstances are quite out of the ordinary, a demand curve will be
A) vertical
B) horizontal
C) downward sloping
D) upward sloping
Correct Answer

verified
Correct Answer
verified
Multiple Choice
The quintessential example for the price of another potential output and the impact of the price of one good on the market for another is
A) Hotdogs and hotdog buns
B) Crude oil and gasoline
C) Corn and soybeans
D) 7up and Sprite
Correct Answer

verified
Correct Answer
verified
Multiple Choice
If a tax (paid by producers) on a good is reduced this would
A) move its supply curve to the right.
B) move its supply curve to the left.
C) cause a movement along the supply curve to a (higher price, higher quantity) point.
D) cause a movement along the supply curve to a (lower price, lower quantity) point.
Correct Answer

verified
Correct Answer
verified
Multiple Choice
A market must be in a physical location
A) True
B) False
Correct Answer

verified
Correct Answer
verified
Multiple Choice
Which of the following is true?
A) the supply curve is downward sloping and demand curve is upward sloping.
B) demand is downward sloping and supply is upward sloping.
C) both the supply curve and the demand curve are downward sloping.
D) both the supply curve and the demand curve are upward sloping.
Correct Answer

verified
Correct Answer
verified
Multiple Choice
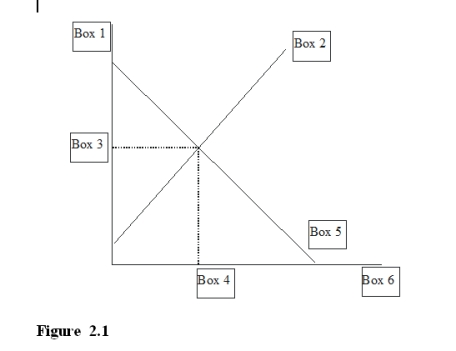
 -In Figure 2.1, Box 1 would be labeled
A) P* for equilibrium price.
B) P for price.
C) S for supply.
D) D for demand.
Correct Answer

verified
Correct Answer
verified
Multiple Choice
In the market for birth control devices, if the number of women of child-bearing age increases, the
A) demand curve will shift to the right.
B) supply curve will shift to the right.
C) demand curve will shift to the left.
D) supply curve will shift to the left.
Correct Answer

verified
Correct Answer
verified
Multiple Choice
Economists know that consumers and producers are both made better off than they would be without free exchange because the exchanges are
A) mandated by government.
B) voluntary.
C) able to make consumers better off by an amount that compensates producers for their losses.
D) able to make producers better off by an amount that compensates consumers for their losses.
Correct Answer

verified
Correct Answer
verified
Showing 101 - 120 of 204
Related Exams