A) only A
B) only B and C
C) only D
D) A, B and C
Correct Answer

verified
Correct Answer
verified
Multiple Choice
When analyzing a problem, if an economist is attempting to understand what caused something to happen without considering whether or not the action was fair or just, the economist is thinking
A) positively.
B) negatively.
C) normatively.
D) justifiably.
Correct Answer

verified
Correct Answer
verified
Multiple Choice
Generalized growth is typically the result of an increase in, or an increase in the ability of resources to
A) produce all goods
B) produce certain goods
C) produce exported goods
D) compete with imported goods
Correct Answer

verified
Correct Answer
verified
Multiple Choice
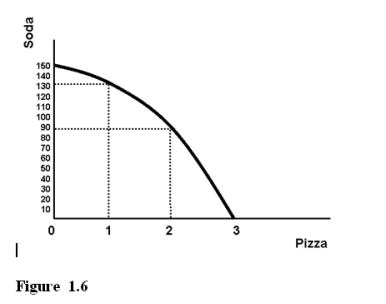 -Using Figure 1.6 you can tell that
A) the technology does not exist to produce 130 units of soda and 1 unit of pizza.
B) there is unemployment.
C) there is constant opportunity cost.
D) the technology does not exist to produce 90 units of soda and 3 units of pizza.
Correct Answer

verified
Correct Answer
verified
Multiple Choice
The statement that "since a farmer will make more money if he has a bumper crop means that all farmers would make more money if they all had bumper crops" would be an example of which of the following?
A) the fallacy that correlation is the same as causation
B) the fallacy of composition
C) truth in an obvious form
D) none of the options are correct
Correct Answer

verified
Correct Answer
verified
Multiple Choice
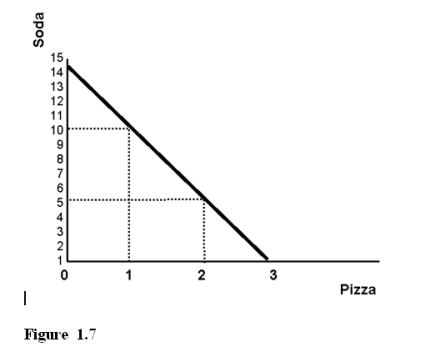 -Using Figure 1.7 we know the production of 4 units of soda and 2 units of pizza is
A) possible, but there would be unemployed resources.
B) possible, but only if all resources were fully employed.
C) impossible because we have the resources but do not have the technology.
D) impossible because we have the technology but do not have the resources.
Correct Answer

verified
Correct Answer
verified
Multiple Choice
Imagine an economist ordering pizza by the slice. When deciding how many slices to order she would pick that number where the enjoyment of the _____ equals the enjoyment she could get from using the money on another good.
A) first slice
B) last slice
C) average slice
D) total number of slices
Correct Answer

verified
Correct Answer
verified
Multiple Choice
Production possibilities frontier models
A) the choices we make in setting prices.
B) the choices we make in setting output alternatives.
C) the choices we make in setting wages.
D) the choices we make in setting incomes.
Correct Answer

verified
Correct Answer
verified
Multiple Choice
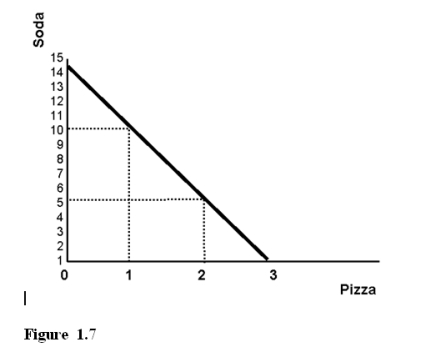 -Using Figure 1.7 we know the production of 10 units of soda and 2 units of pizza is
A) possible, but there would be unemployed resources.
B) possible, but only if all resources were fully employed.
C) impossible because we either do not have the resources or the technology.
D) undesirable.
Correct Answer

verified
Correct Answer
verified
Multiple Choice
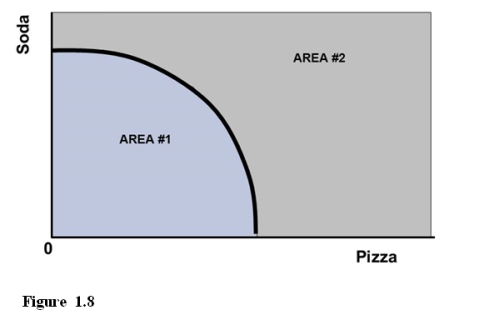 -Referring to Figure 1.8, if a point represents unemployment it is in
A) AREA #1 but not on the curve.
B) AREA #1 or is on the curve.
C) AREA #2 but not on the curve.
D) AREA #2 or is on the curve.
Correct Answer

verified
Correct Answer
verified
Multiple Choice
Scarcity implies that the allocation scheme chosen by society can
A) not make more of any one good.
B) typically make more of a good but at the expense of making less of another.
C) always make more of all goods simultaneously.
Correct Answer

verified
Correct Answer
verified
Multiple Choice
If the (steadily decreasing) marginal benefit of another day spent in the hospital exceeds the (steadily increasing) marginal cost of an additional day spent in the hospital, the rational consumer of hospital services would be predicted to
A) check out of the hospital immediately.
B) stay in the hospital for at least that additional day.
C) demand a refund from the hospital for the previous day's stay.
D) complain about the hospital food.
Correct Answer

verified
Correct Answer
verified
Multiple Choice
The underlying reason that there are unattainable points on a production possibilities frontier diagram is that there
A) is government.
B) are always choices that have to be made.
C) is a scarcity of resources within a fixed level of technology.
D) is unemployment of resources.
Correct Answer

verified
Correct Answer
verified
Multiple Choice
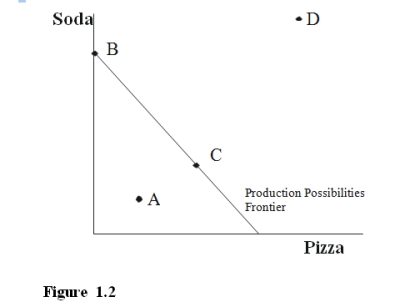 -In Figure 1.2, which labeled points represent the existence of unemployment?
A) only A
B) only B and C
C) only D
D) A, B and C
Correct Answer

verified
Correct Answer
verified
Multiple Choice
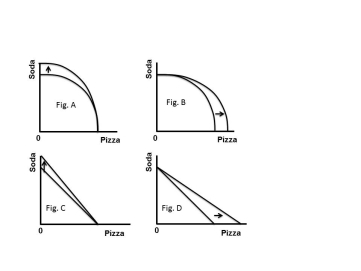 Figure 1.10
-Referring to the Production Possibilities Frontiers in Figure 1.10 A, B, C, and D, which depicts specialized growth in soda when there is constant opportunity cost.
A) Fig. A
B) Fig. B
C) Fig. C
D) Fig. D
Correct Answer

verified
Correct Answer
verified
Multiple Choice
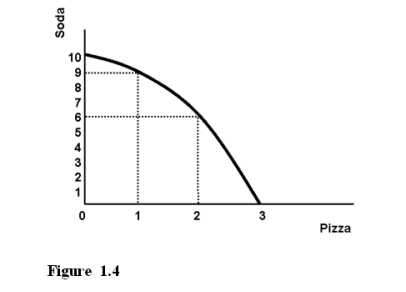 -Using Figure 1.4 we know the production of 9 units of soda and 1 units of pizza is
A) possible, but there would be unemployment.
B) possible, but only if all resources were fully employed.
C) impossible because we have the resources but do not have the technology.
D) impossible because we have the technology but do not have the resources.
Correct Answer

verified
Correct Answer
verified
Multiple Choice
An economist, when analyzing a problem will attempt to
A) maximize the net benefit of an action and this occurs where the marginal benefit equals the marginal cost.
B) maximize the total benefit of an action.
C) minimize the total cost of an action.
D) maximize the net benefit of an action and this occurs where the average benefit equals the average cost.
Correct Answer

verified
Correct Answer
verified
Multiple Choice
Figure 1.11 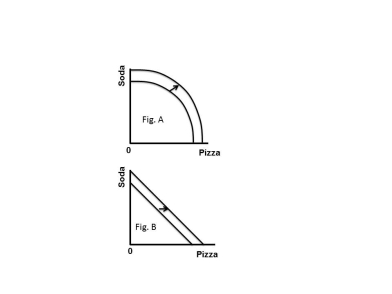 -Referring to the Production Possibilities Frontiers in Figure 1.11 A and B, which depicts specialized growth
A) Fig. A
B) Fig. B
C) Either Fig. A or B is correct
D) Neither Fig. A nor B are correct
Correct Answer

verified
Correct Answer
verified
Multiple Choice
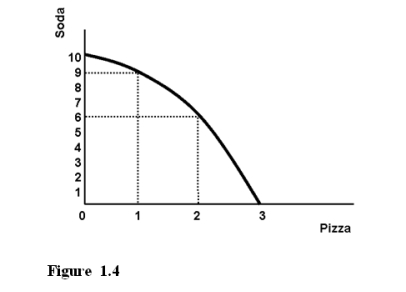 -Referring to Figure 1.4, the opportunity cost of producing the first unit of pizza is
A) one unit of soda.
B) three units of soda.
C) six units of soda.
D) the same as the opportunity cost of producing the second unit of pizza.
Correct Answer

verified
Correct Answer
verified
Multiple Choice
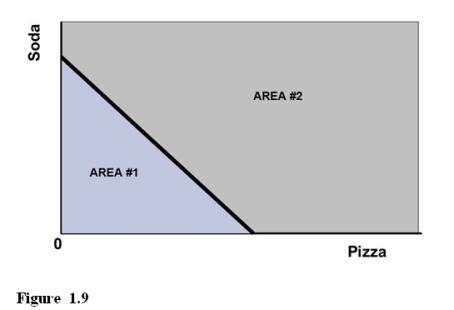 -Referring to Figure 1.9, if a point is unattainable it is in
A) AREA #1 but not on the curve.
B) AREA #1 or is on the curve.
C) AREA #2 but not on the curve.
D) AREA #2 or is on the curve.
Correct Answer

verified
Correct Answer
verified
Showing 61 - 80 of 124
Related Exams