A) $12,and the equilibrium quantity is 35.
B) $8,and the equilibrium quantity is 50.
C) $5,and the equilibrium quantity is 35.
D) $5,and the equilibrium quantity is 50.
Correct Answer

verified
Correct Answer
verified
Multiple Choice
In the market for widgets,the supply curve is the typical upward-sloping straight line,and the demand curve is the typical downward-sloping straight line.The equilibrium quantity in the market for widgets is 200 per month when there is no tax.Then a tax of $5 per widget is imposed.As a result,the government is able to raise $800 per month in tax revenue.We can conclude that the equilibrium quantity of widgets has fallen by
A) 40 per month.
B) 50 per month.
C) 75 per month.
D) 100 per month.
Correct Answer

verified
Correct Answer
verified
Multiple Choice
Figure 8-12 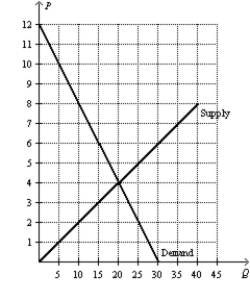 -Refer to Figure 8-12.Suppose a $3 per-unit tax is placed on this good.The amount of deadweight loss resulting from this tax is
A) $7.50.
B) $15.00.
C) $22.50.
D) $45.00.
Correct Answer

verified
Correct Answer
verified
Multiple Choice
Figure 8-3
The vertical distance between points A and C represents a tax in the market.  -Refer to Figure 8-3.The price that sellers effectively receive after the tax is imposed is
A) P1.
B) P2.
C) P3.
D) P4.
Correct Answer

verified
Correct Answer
verified
Multiple Choice
Figure 8-1 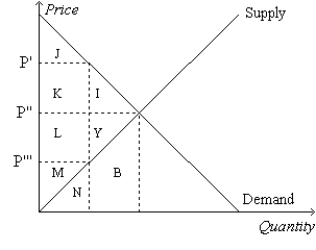 -Refer to Figure 8-1.Suppose the government imposes a tax of P' - P'''.The tax revenue is measured by the area
A) K+L.
B) I+Y.
C) J+K+L+M.
D) I+J+K+L+M+Y.
Correct Answer

verified
Correct Answer
verified
Multiple Choice
Figure 8-6
The vertical distance between points A and B represents a tax in the market. 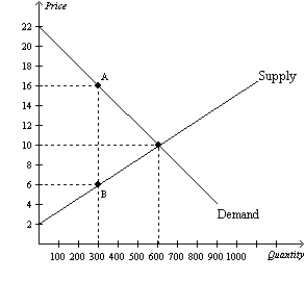 -Refer to Figure 8-6.When the tax is imposed in this market,the price sellers effectively receive is
A) $4.
B) $6.
C) $10.
D) $16.
Correct Answer

verified
Correct Answer
verified
Multiple Choice
Figure 8-1  -Refer to Figure 8-1.Suppose the government imposes a tax of P' - P'''.Total surplus before the tax is measured by the area
A) I+Y.
B) J+K+L+M.
C) L+M+Y.
D) I+J+K+L+M+Y.
Correct Answer

verified
Correct Answer
verified
Multiple Choice
Figure 8-9
The vertical distance between points A and C represents a tax in the market. 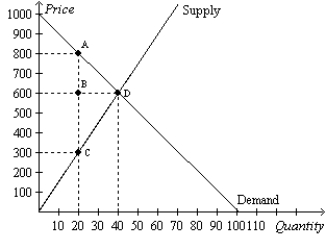 -Refer to Figure 8-9.The total surplus without the tax is
A) $8,000.
B) $12,000.
C) $20,000.
D) $40,000.
Correct Answer

verified
Correct Answer
verified
Multiple Choice
Figure 8-10 ![Figure 8-10 -Refer to Figure 8-10.Suppose the government imposes a tax that reduces the quantity sold in the market after the tax to Q2.With the tax,the total surplus is A) [1/2 x (P0-P5) x Q5] + [1/2 x (P5-0) x Q5]. B) [1/2 x (P0-P2) x Q2] +[(P2-P8) x Q2] + [1/2 x (P8-0) x Q2]. C) (P2-P8) x Q2. D) 1/2 x (P2-P8) x (Q5-Q2) .](https://d2lvgg3v3hfg70.cloudfront.net/TB2297/11ea9365_a6d1_0f5f_b28d_fb630e3ffe04_TB2297_00_TB2297_00_TB2297_00_TB2297_00_TB2297_00_TB2297_00_TB2297_00_TB2297_00_TB2297_00_TB2297_00_TB2297_00.jpg) -Refer to Figure 8-10.Suppose the government imposes a tax that reduces the quantity sold in the market after the tax to Q2.With the tax,the total surplus is
-Refer to Figure 8-10.Suppose the government imposes a tax that reduces the quantity sold in the market after the tax to Q2.With the tax,the total surplus is
A) [1/2 x (P0-P5) x Q5] + [1/2 x (P5-0) x Q5].
B) [1/2 x (P0-P2) x Q2] +[(P2-P8) x Q2] + [1/2 x (P8-0) x Q2].
C) (P2-P8) x Q2.
D) 1/2 x (P2-P8) x (Q5-Q2) .
Correct Answer

verified
Correct Answer
verified
Multiple Choice
Figure 8-10 ![Figure 8-10 -Refer to Figure 8-10.Suppose the government imposes a tax that reduces the quantity sold in the market after the tax to Q2.The deadweight loss of the tax is A) [1/2 x (P0-P5) x Q5] + [1/2 x (P5-0) x Q5]. B) [1/2 x (P0-P2) x Q2] +[(P2-P8) x Q2] + [1/2 x (P8-0) x Q2]. C) (P2-P8) x Q2. D) 1/2 x (P2-P8) x (Q5-Q2) .](https://d2lvgg3v3hfg70.cloudfront.net/TB2297/11ea9365_a6d1_0f5f_b28d_fb630e3ffe04_TB2297_00_TB2297_00_TB2297_00_TB2297_00_TB2297_00_TB2297_00_TB2297_00_TB2297_00_TB2297_00_TB2297_00_TB2297_00.jpg) -Refer to Figure 8-10.Suppose the government imposes a tax that reduces the quantity sold in the market after the tax to Q2.The deadweight loss of the tax is
-Refer to Figure 8-10.Suppose the government imposes a tax that reduces the quantity sold in the market after the tax to Q2.The deadweight loss of the tax is
A) [1/2 x (P0-P5) x Q5] + [1/2 x (P5-0) x Q5].
B) [1/2 x (P0-P2) x Q2] +[(P2-P8) x Q2] + [1/2 x (P8-0) x Q2].
C) (P2-P8) x Q2.
D) 1/2 x (P2-P8) x (Q5-Q2) .
Correct Answer

verified
Correct Answer
verified
Multiple Choice
Figure 8-7
The vertical distance between points A and B represents a tax in the market. 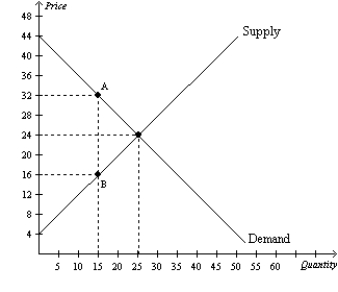 -Refer to Figure 8-7.The deadweight loss associated with this tax amounts to
A) $80,and this figure represents the amount by which tax revenue to the government exceeds the combined loss of producer and consumer surpluses.
B) $80,and this figure represents the surplus that is lost because the tax discourages mutually advantageous trades between buyers and sellers.
C) $60,and this figure represents the amount by which tax revenue to the government exceeds the combined loss of producer and consumer surpluses.
D) $60,and this figure represents the surplus that is lost because the tax discourages mutually advantageous trades between buyers and sellers.
Correct Answer

verified
Correct Answer
verified
Multiple Choice
Suppose a tax of $4 per unit is imposed on a good,and the tax causes the equilibrium quantity of the good to decrease from 2,000 units to 1,700 units.The tax decreases consumer surplus by $3,000 and decreases producer surplus by $4,400.The deadweight loss of the tax is
A) $200.
B) $400.
C) $600.
D) $1,200.
Correct Answer

verified
Correct Answer
verified
Multiple Choice
Figure 8-11 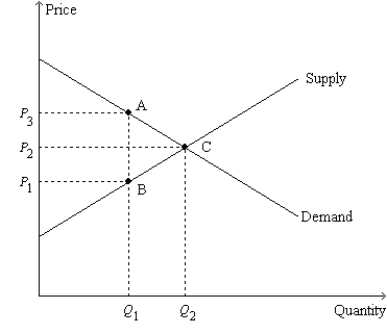 -Refer to Figure 8-11.Neither a shift of the demand curve nor a shift of the supply curve is shown on the figure.However,we know that,when the tax is imposed,
A) the demand curve will shift.
B) the supply curve will shift.
C) either the demand curve or the supply curve will shift.
D) None of the above are correct;the tax causes neither the demand curve nor the supply curve to shift.
Correct Answer

verified
Correct Answer
verified
Multiple Choice
Figure 8-1  -Refer to Figure 8-1.Suppose the government imposes a tax of P' - P'''.The consumer surplus before the tax is measured by the area
A) M.
B) L+M+Y.
C) J.
D) J+K+I.
Correct Answer

verified
Correct Answer
verified
Multiple Choice
The benefit to buyers of participating in a market is measured by
A) the price elasticity of demand.
B) consumer surplus.
C) the maximum amount that buyers are willing to pay for the good.
D) the equilibrium price.
Correct Answer

verified
Correct Answer
verified
Multiple Choice
Figure 8-8
Suppose the government imposes a $10 per unit tax on a good. 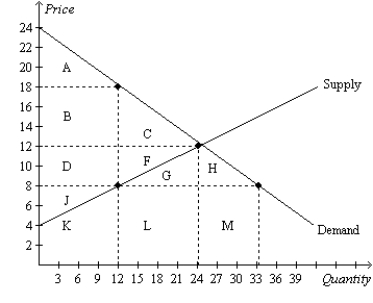 -Refer to Figure 8-8.The tax causes consumer surplus to decrease by the area
A) A.
B) B+C.
C) A+B+C.
D) A+B+C+D+F.
Correct Answer

verified
Correct Answer
verified
Multiple Choice
Figure 8-7
The vertical distance between points A and B represents a tax in the market.  -Refer to Figure 8-7.As a result of the tax,
A) consumer surplus decreases from $200 to $80.
B) producer surplus decreases from $200 to $145.
C) the market experiences a deadweight loss of $80.
D) All of the above are correct.
Correct Answer

verified
Correct Answer
verified
Multiple Choice
Figure 8-4
The vertical distance between points A and B represents a tax in the market. 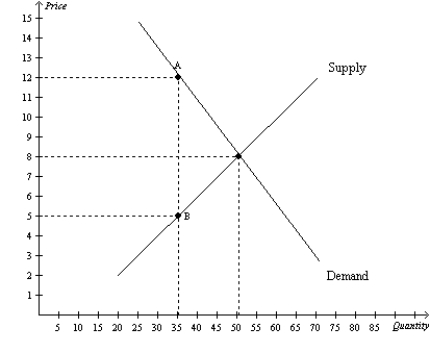 -Refer to Figure 8-4.The price that sellers effectively receive after the tax is imposed is
A) $12.
B) between $8 and $12.
C) between $5 and $8.
D) $5.
Correct Answer

verified
Correct Answer
verified
Multiple Choice
Figure 8-6
The vertical distance between points A and B represents a tax in the market.  -Refer to Figure 8-6.When the tax is imposed in this market,buyers effectively pay what amount of the $10 tax?
A) $0
B) $4
C) $6
D) $10
Correct Answer

verified
Correct Answer
verified
Multiple Choice
When a tax is placed on the buyers of a product,a result is that buyers effectively pay
A) less than before the tax,and sellers effectively receive less than before the tax.
B) less than before the tax,and sellers effectively receive more than before the tax.
C) more than before the tax,and sellers effectively receive less than before the tax.
D) more than before the tax,and sellers effectively receive more than before the tax.
Correct Answer

verified
Correct Answer
verified
Showing 101 - 120 of 247
Related Exams