A) About -0.95
B) About -0.72
C) Close to 0
D) About 0.72
E) About 0.95
Correct Answer

verified
D
Correct Answer
verified
Multiple Choice
In a scatterplot we can see
A) a display of the five-number summary.
B) whether or not we have a simple random sample.
C) the shape, center, and spread of the distribution of a quantitative variable.
D) the form, direction, and strength of a relationship between two quantitative variables.
Correct Answer

verified
Correct Answer
verified
Multiple Choice
According to the USA Today web page that tracks such occurrences, NFL quarterbacks are arrested less often (on average) than running backs, who, in turn, are arrested less often than linemen. The correlation coefficient r between a player's position and his number of arrests:
A) is positive.
B) is near zero.
C) is negative.
D) makes no sense.
Correct Answer

verified
Correct Answer
verified
Multiple Choice
Which of the following are most likely to be negatively correlated?
A) The total floor space and the price of an apartment in New York
B) The percentage of body fat and the time it takes to run a mile for male college students
C) The heights and yearly earnings of 35-year-old U.S. adults
D) The prices and the weights of all racing bicycles sold last year in Chicago
Correct Answer

verified
Correct Answer
verified
Multiple Choice
A random sample of statistics students was selected. The heights (inches) and the weights (pounds) of the students were collected and are displayed in the figure below. 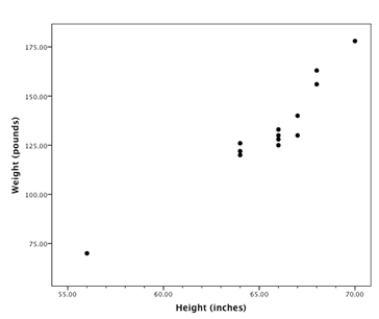 What is the approximate correlation between these two variables?
A) About -0.95
B) About -0.72
C) Close to 0
D) About 0.72
E) About 0.95
Correct Answer

verified
Correct Answer
verified
Multiple Choice
An analyst gathers data on the number of hours of political debates watched per week and the sales of antacids. She expects that political debate watching will help explain antacid sales. The plot of the data in the preceding question shows that people who watch more political debates tend to buy more antacids. The analyst calculates the correlation r between hours of debates and antacids purchased. A plausible value is:
A) r = -1.
B) r = -0.4.
C) r = 0.
D) r = 0.4.
Correct Answer

verified
Correct Answer
verified
Multiple Choice
Which of the statements does not contain a statistical blunder?
A) There is a strong negative correlation between a person's sex and the amount that he or she pays for automobile insurance.
B) The mean height of young women is 64 inches, and the correlation between their heights and weights is 0.6 inches.
C) The correlation between height and weight for adult females is about r = 1.2.
D) All three prior statements contain blunders.
Correct Answer

verified
D
Correct Answer
verified
Multiple Choice
All 753 students in grades 1 through 6 in an elementary school are given a math test that was designed for third graders. The heights of all 753 students are also recorded. We expect to see _______________ between height and test score.
A) positive association
B) little or no association
C) negative association
D) either positive or negative association (but it's hard to predict which)
Correct Answer

verified
Correct Answer
verified
Multiple Choice
Which of the values below is impossible for the descriptive measure in question?
A) r = -1.25
B) ![]() = -0.2
= -0.2
C) s = -3.4
D) Both r = -1.25 and s = -3.4 are correct.
E) Both![]() = -0.2 and s = -3.4 are correct.
= -0.2 and s = -3.4 are correct.
Correct Answer

verified
Correct Answer
verified
Multiple Choice
Which of these is not true of the correlation r between the weight in pounds and gas mileage in miles-per-gallon for a sample of pickup trucks?
A) r must take a value between -1 and 1.
B) r is measured in pounds.
C) If heavier pickup trucks tend to also get lower gas mileage, then r < 0.
D) r would not change if we measured these trucks in kilograms instead of pounds.
E) Both "r is measured in pounds" and "r would not change if we measured these trucks in kilograms instead of pounds" are correct.
Correct Answer

verified
Correct Answer
verified
Multiple Choice
An education researcher measured the IQ test scores of 78 seventh-grade students in a rural school, and also their school grade point average (GPA) measured on a 12-point scale. Here is a graph of GPA versus IQ for these students: 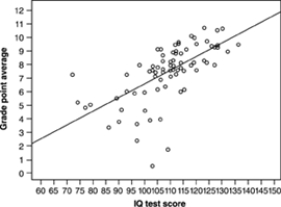 The IQ score of the student who has the lowest GPA is about
A) 103.
B) 0.6.
C) 72.
D) 7.2.
Correct Answer

verified
Correct Answer
verified
Multiple Choice
A study found correlation r = 0.43 between high school math grades (on a 0 to 100 scale) and income 10 years after high school. This means that
A) people with high math grades tend to have higher income than people with low math grades.
B) people with low math grades tend to have higher income than people with high math grades.
C) there is almost no association between math grades and income.
D) a mistake has been made because a correlation cannot be 0.43.
E) a mistake has been made because a correlation between math grades and income makes no sense.
Correct Answer

verified
Correct Answer
verified
Multiple Choice
An education researcher measured the IQ test scores of 78 seventh-grade students in a rural school, and also their school grade point average (GPA) measured on a 12-point scale. Here is a graph of GPA versus IQ for these students: 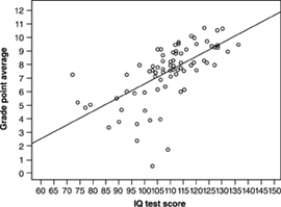 The graph shows
A) a clear positive association.
B) very little association.
C) a clear negative association.
D) a skewed distribution.
Correct Answer

verified
Correct Answer
verified
Multiple Choice
Which statistical measure is not strongly affected by a few outliers in the data?
A) The mean
B) The median
C) The standard deviation
D) The correlation coefficient
Correct Answer

verified
Correct Answer
verified
Multiple Choice
A random sample of statistics students was selected. The heights (inches) and the weights (pounds) of the students were collected and are displayed in the figure below. 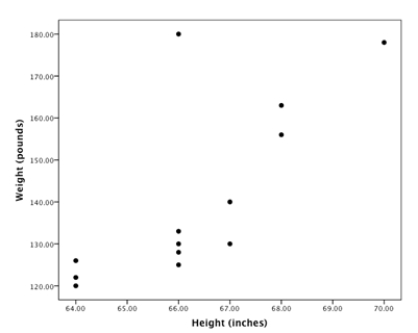 There is a student whose measurements were outliers in the data set. What do you expect will happen to the correlation if that student's measurements are removed?
A) The correlation will be greater than (further from zero) it was.
B) The correlation will be less than (closer to zero) it was.
C) The correlation will remain the same as it was.
D) There is not enough information to determine how the correlation might change.
Correct Answer

verified
A
Correct Answer
verified
Multiple Choice
Which of these statements is true of the correlation r?
A) r can only take values 0 or greater than 0.
B) r can only take values between -1 and 1, inclusive.
C) r describes only straight-line relationships.
D) Both "r can only take values 0 or greater than 0" and "r describes only straight-line relationships." are correct.
E) Both "r can only take values between -1 and 1, inclusive" and "r describes only straight-line relationships" are correct.
Correct Answer

verified
Correct Answer
verified
Multiple Choice
A nutrition study measuring how many helpings of vegetables each of 125 grade school children were served each week during a school year and their body mass index (BMI) scores found r = -0.13. This tells that:
A) children who ate more vegetables tend to have lower BMI scores, but it is a weak association.
B) children who ate more vegetables tend to have lower BMI scores, and it is a strong association.
C) children who ate more vegetables tend to have higher BMI scores, but it is a weak association.
D) children who ate more vegetables tend to have higher BMI scores, and it is a strong association.
Correct Answer

verified
Correct Answer
verified
Multiple Choice
The numerical value of a correlation coefficient can be
A) any number.
B) zero or any positive number.
C) any number between 0 and 1.
D) any number between -1 and 1.
E) any number between -1 and 1 other than 0.
Correct Answer

verified
Correct Answer
verified
Multiple Choice
An education researcher measured the IQ test scores of 78 seventh-grade students in a rural school, and also their school grade point average (GPA) measured on a 12-point scale. Here is a graph of GPA versus IQ for these students: 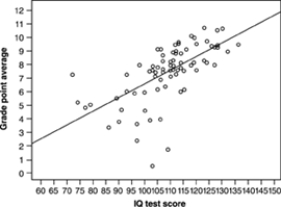 One of these numbers is the correlation r between IQ score and GPA. Which is it?
A) r = 0.02
B) r = 0.63
C) r = 0.95
D) r = -0.63
E) r = -0.95
Correct Answer

verified
Correct Answer
verified
Multiple Choice
How well does the number of beers a student drinks predict his or her blood alcohol content? Sixteen student volunteers at The Ohio State University drank a randomly assigned number of cans of beer. Thirty minutes later, a police officer measured their blood alcohol content (BAC) . A scatterplot of the data appears below. 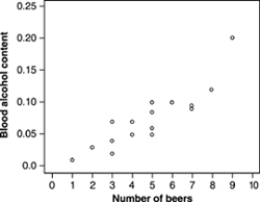 A plausible value of the correlation between number of beers and blood alcohol content, based on the scatterplot, is
A) r = -0.85.
B) r = -0.3.
C) r close to 0.
D) r = 0.3.
E) r = 0.85.
Correct Answer

verified
Correct Answer
verified
Showing 1 - 20 of 56
Related Exams